
High-RPV Affiliate Programs: How to Pick Partners That Pay 10x More Per Visitor
Not all affiliate programs are equal. Learn how to identify high-RPV programs using the 4-metric scorecard — and why commission rate alone tells you nothing.
The Commission Rate Trap
Every affiliate marketing post you’ve read probably told you to find “high commission programs.” Look for 30%, 40%, 50% commissions. Avoid programs under 10%. It sounds logical, and it’s almost completely wrong.
Here’s why: commission rate is one variable in a multi-variable equation. A blogger promoting a 50% commission product earning $0.002 per visitor is getting destroyed by a blogger promoting a 5% commission product earning $0.08 per visitor. Commission rate, disconnected from conversion rate, product price, and offer-intent alignment, is meaningless.
The metric that actually matters is Revenue Per Visitor (RPV) at the program level — how much revenue does this specific affiliate program generate per unique visitor who lands on content promoting it. That’s the number to optimize.
We cover the building blocks of affiliate content strategy in detail in our guide to 5 Affiliate Marketing Content Structures That Actually Convert. This article is specifically about selecting the right programs before you write a single word of content.
Why Program Selection Determines 70% of Your Affiliate RPV
Most bloggers treat affiliate program selection as an afterthought — they create content on a topic, then find the most well-known product in that space and sign up for their affiliate program. This is backwards.
Program selection should happen before content creation. Your content structure, keyword targeting, and CTA strategy should all flow from which programs you’ve decided to promote. The reason: different programs perform radically differently even within the same niche, and the performance gap is predictable if you know what metrics to evaluate.
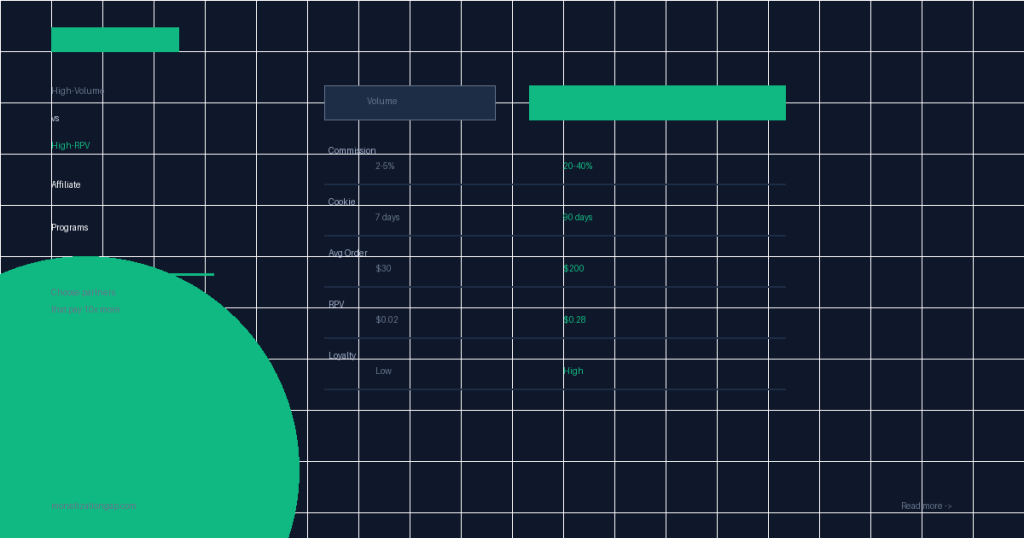
Consider two email marketing affiliate programs:
Program B wins because the combination of product price and conversion rate overwhelms Program A’s higher commission percentage. This is why you need a scorecard, not a single metric.
The 4-Metric RPV Scorecard
Before joining any affiliate program, evaluate it on these four metrics. You can estimate most of them from public data before you apply.
The 4-Metric Affiliate RPV Scorecard
Effective Earnings Per Click (EPC)
This is the single most important number if the program publishes it. EPC = (Total commissions earned ÷ Total clicks). Many affiliate networks (ShareASale, CJ Affiliate, Impact) show public EPC data. A program with a $2.50 EPC means affiliates earn $2.50 per 100 clicks on average — meaning $0.025 RPV assuming 100% of visitors click. Higher EPC = higher RPV ceiling.
Offer-Intent Alignment Score
How closely does this product match the exact search intent of your target keywords? Rate this 1–5. A product that directly solves what your readers searched for scores 5. A tangentially related product scores 1–2. Alignment score is the conversion multiplier — a 5/5 alignment product at 15% commission will often outperform a 50% commission product at 1/5 alignment.
Cookie Window & Attribution Model
A 30-day cookie captures buyers who research via your article but convert later. A 1-day cookie loses them. For products with longer decision cycles (SaaS tools, courses, high-ticket services), cookie window directly impacts earned commissions. Minimum acceptable: 30 days. Ideal: 60–90 days or lifetime cookie.
Recurring vs. One-Time Commission
Recurring commission programs (where you earn monthly as long as the referred customer remains a subscriber) have dramatically higher lifetime RPV. A product paying $10/month recurring commission will outperform a $50 one-time commission within 5 months, and compounds from there. Prioritize recurring programs in subscription-based product categories (SaaS, memberships).
How to Estimate RPV Before Joining a Program
Step 1: Find public EPC data
ShareASale, CJ Affiliate, and Impact all display EPC data on their public program listings. Filter by your niche and sort by 30-day EPC. This gives you a ranked list of programs by actual affiliate earnings — not commission rates.
Step 2: Calculate theoretical program RPV
If EPC data isn’t available, use this formula:
Step 3: Evaluate competitor promotion frequency
Use Ahrefs or SEMrush to find which products your top 5 competitors link to most frequently. High-frequency promotion from established publishers is a strong signal of high RPV — publishers don’t maintain affiliate links for products that don’t convert.
Niche-by-Niche: Where to Find High-RPV Programs
| Niche | Program Type | Typical EPC | Typical RPV | Best Networks |
|---|---|---|---|---|
| Personal Finance | Credit cards, investing apps, tax software | $8–$45 | $0.12–$0.35 | CJ Affiliate, Direct |
| SaaS / Marketing Tools | Email platforms, SEO tools, landing page builders | $5–$30 | $0.10–$0.40 | Impact, PartnerStack |
| Web Hosting / Domains | Hosting providers, domain registrars, CDN | $50–$150 | $0.08–$0.25 | ShareASale, Direct |
| Health / Supplements | Supplement brands, fitness programs, meal kits | $2–$12 | $0.04–$0.15 | ShareASale, CJ |
| Online Education | Courses, ebooks, coaching programs | $15–$80 | $0.08–$0.30 | ClickBank, Impact |
Want the full framework?
The Monetization Gap Playbook includes a complete program selection worksheet, EPC benchmarks by niche, and a 90-day affiliate audit framework.
Red Flags: Programs That Look Good But Aren’t
High commission + low EPC = bad product funnel
If a program offers 40%+ commission but shows weak EPC in network data (or the program is new with no EPC history), it’s a signal that the product’s own conversion funnel is broken. You send traffic; the traffic doesn’t convert because the sales page is poor, the pricing is off, or the offer is unclear. High commission rates are sometimes a publisher-acquisition tactic by programs with conversion problems.
Short cookie windows in high-consideration categories
A 1-day cookie for a $299 software product is a trap. Readers need time to try the free trial and decide. Programs in high-consideration categories (enterprise software, online courses, financial products) should offer 30+ day cookies at minimum. If they don’t, it’s either inexperience or deliberate undercompensation of publishers.
Low average order value with high nominal commissions
A 50% commission on a $9.99 product is $5 per sale. You’d need 200 conversions to earn $1,000. At a 2% conversion rate, that’s 10,000 clicks. Compare to a 10% commission on a $299 product ($30/sale) — you’d need only 34 conversions for the same $1,000, with 1,700 clicks at 2% conversion. Do the math before you write content.
No recurring component on SaaS products
Most SaaS affiliate programs offer either one-time or recurring commissions. One-time programs pay out once; recurring programs pay every month the customer stays. If a SaaS product has reasonable retention (most do), the recurring program will pay 3–5x more over 12 months. Always choose recurring when available.
Building Your Program Portfolio
The 3-tier portfolio structure
High-RPV affiliate strategies typically use a tiered program structure:
- Tier 1 — Anchor Programs (1–2): Your highest-RPV programs. These get dedicated review posts, comparison articles, and deep integration in your email sequence. These are your primary revenue drivers.
- Tier 2 — Supporting Programs (3–5): Solid performers with good alignment to specific content categories. These appear in roundup posts and are mentioned in tutorials where relevant.
- Tier 3 — Contextual Programs (5–10): Niche-specific programs that only appear when content is directly relevant. Low-maintenance, low-volume, but add incremental RPV without extra work.
How often to audit your portfolio
Affiliate programs change — commissions get cut, products deteriorate, better alternatives emerge. Review your program portfolio quarterly:
- Calculate actual RPV per program for the past 90 days
- Drop any program generating under $0.01 RPV (it’s consuming link inventory without return)
- Test one new candidate program per quarter against your lowest Tier 2 performer
- Check if any Tier 1 competitors have changed commission structures
The Content-Program Fit Matrix
Not every program works in every content type. Match your programs to content formats for maximum RPV:
| Content Type | Best Program Tiers | Optimal Placement | RPV Potential |
|---|---|---|---|
| “Best X” roundup | Tier 1 + Tier 2 | Featured pick + comparison table | High ($0.10–$0.25) |
| Product review | Tier 1 (single product) | Intro, features, final verdict | High ($0.15–$0.40) |
| X vs Y comparison | Tier 1 + Tier 2 | Verdict section + CTA box | Very high ($0.20–$0.50) |
| Tutorial / How-to | Tier 2 + Tier 3 | Tool recommendation in steps | Medium ($0.04–$0.12) |
| Informational / FAQ | Tier 3 | Contextual mentions | Low ($0.01–$0.05) |
Tracking Program RPV in Practice
Setting up program-level tracking
Most affiliate networks provide reporting that shows clicks and commissions. To calculate program RPV, you need one additional data point: the traffic each piece of content gets. Here’s the simple formula:
Track this monthly for each program. Programs that don’t improve over 3 months despite content optimization should be replaced with higher-RPV alternatives.
The Compounding Effect of Program Optimization
Here’s what most bloggers underestimate: the compounding effect of replacing low-RPV programs with high-RPV ones on content that already ranks. You don’t need more traffic to see dramatic revenue improvements — you just need better programs on your existing high-traffic pages.
A page getting 3,000 monthly visitors:
- With a $0.02 RPV program: $60/month
- With a $0.12 RPV program: $360/month
- With a $0.28 RPV program: $840/month
Same page, same traffic, same content. Only the program changed. That’s a 14x revenue difference. Program selection is the highest-leverage activity in affiliate monetization.
Frequently Asked Questions
Stop Guessing Which Programs to Promote
The Monetization Gap Playbook gives you the complete program selection system — the 4-metric scorecard, RPV benchmarks by niche, and quarterly audit templates.